Shashikant shah

Friday, 21 March 2025

Kubernetes Security - CIS Benchmarking

 CIS (Center for Internet Security) Kubernetes Benchmark provides security guidelines for configuring Kubernetes clusters to enhance security and compliance.

CIS Kubernetes Benchmark is a set of security best practices covering:
i) API Server hardening
ii) Secure etcd configuration
iii) RBAC and authentication
iv) Secure networking and pod security
v) Logging and auditing

Two security scans tools.

Regularly scan your cluster using kube-bench or Kubescape.


# wget https://github.com/aquasecurity/kube-bench/releases/download/v0.10.4/kube-bench_0.10.4_linux_amd64.tar.gz

# tar xvf kube-bench_0.10.4_linux_amd64.tar.gz

# chmod +x kube-bench

# mv kube-bench /usr/local/bin/

# kube-bench --config-dir `pwd`/cfg --config `pwd`/cfg/config.yaml

Check the Results

After running, it provides:

  • PASS: Configurations following CIS recommendations.
  • WARN: Potential security risks.
  • FAIL: Misconfigurations violating security best practices.


# curl -s https://raw.githubusercontent.com/kubescape/kubescape/master/install.sh | /bin/bash

# kubescape scan framework all


Monday, 10 March 2025

Backup and restore etcd in the k8s cluster.

Backup and restore etcd in the k8s cluster.

 
1.Backup certificate.

# mkdir -p /root/backup_cluster/certificate

# cp -rf  /etc/kubernetes/pki  /root/backup_cluster/certificate

# ls /root/backup_cluster/certificate/pki/


2. Backup etcd db.

# mkdir -p /root/backup_cluster/etcd_backup

# ETCDCTL_API=3 etcdctl snapshot save /root/backup_cluster/etcd_backup/etcd_snapshot_v2.db --endpoints=https://127.0.0.1:2379 --cacert /etc/kubernetes/pki/etcd/ca.crt --cert /etc/kubernetes/pki/etcd/healthcheck-client.crt --key /etc/kubernetes/pki/etcd/healthcheck-client.key

3. Reset kuberenets cluster

# kubeadm reset

# rm -rf .kube

4.Copy all Certificates to /etc/Kubernetes/ directory.

# cp -rf /root/backup_cluster/certificate/pki   /etc/kubernetes/

5. Restore etcd command:

# ETCDCTL_API=3 etcdctl snapshot restore /root/backup_cluster/etcd_backup/etcd_snapshot_v2.db


 # mv default.etcd/member /var/lib/etcd/

 # ls -l /var/lib/etcd


6.Initialize a Kubernetes cluster.

(note:- Old CIDR will be updated as etcd is not being updated.)
# kubeadm init --pod-network-cidr=192.171.0.0/16  --apiserver-advertise-address=192.168.56.113 --ignore-preflight-errors=DirAvailable--var-lib-etcd


# mkdir -p $HOME/.kube

# sudo cp -i /etc/kubernetes/admin.conf $HOME/.kube/config

# sudo chown $(id -u):$(id -g) $HOME/.kube/config
# kubeadm join 192.168.56.113:6443 --token whhuns.xo594wt6cuu8n8by \
        --discovery-token-ca-cert-hash sha256:c77e46bb10ed45d34b17dd384fec50b97ae244d0ff0864ba934ee3f69c436af9 
# kubectl get nodes


# kubectl get cs


 How to change pod subnet CIDR.

i)update cidr  in kube-controller-manager.yaml file.

# vim /etc/kubernetes/manifests/kube-controller-manager.yaml

- --cluster-cidr=192.171.0.0/16


ii)update cidr  in kubeadm-config.

# kubectl -n kube-system edit cm kubeadm-config

podSubnet: 192.171.0.0/16


iii)update cidr  in ippool.

# kubectl get ippool

# kubectl edit ippool default-ipv4-ippool

cidr: 192.171.0.0/16


Note:- need to restart all nodes one by one.
iv) validate cdir in the cluster.
# ps -elf | grep "cidr"


v) Check ip for Pod.

# kubectl get pods -o wide


ETCD High-Availability (HA) in Kubernetes.


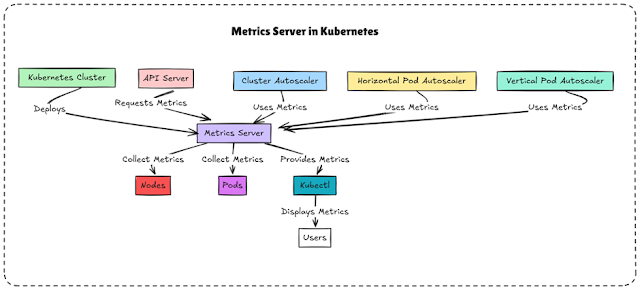
A high-availability (HA) etcd cluster is essential for ensuring Kubernetes remains operational even during failures. etcd acts as the brain of Kubernetes, storing all cluster data, including Pods, Nodes, ConfigMaps, and Secrets. If etcd fails, Kubernetes cannot function properly.

1.In a 3-node etcd cluster, if one node fails, the remaining two nodes keep the cluster running.

2.If etcd is highly available, Kubernetes API requests (kubectl commands, deployments, scaling, etc.) continue to work without disruption.

3.One node acts as the leader, and others as followers. If the leader fails, a new leader is elected automatically.

4.etcd ensures strong consistency—every etcd node has the same data. Writes are replicated across all nodes in the cluster.

5.A large cluster (1000+ nodes) requires an HA etcd cluster to avoid API slowdowns and failures.


1. Create a certificate on one master node.

2. Install and configure etcd on master nodes.

3. Install and configure haproxy on one master node.

4. install and configure kubernetes on master nodes.

5. install and configure the worker node.

Nodes

IP address

ETCD01

192.168.56.15

ETCD02

192.168.56.16

ETCD03

192.168.56.17

VIP

192.168.56.18


# yum update -y

Disable selinux  and firewalld

# systemctl stop firewalld

# systemctl disable firewalld

# /etc/sysconfig/selinux

SELINUX=disable


Update hostname and  /etc/hosts file

# vim /etc/hostname

ETCD01

# hostname  ETCD01

# vim /etc/hosts

192.168.56.15   ETCD01

192.168.56.16   ETCD02

192.168.56.17   ETCD03


1. Download the required binaries for TLS certificates.

# mkdir  -p tls_certificate

# cd tls_certificate

# wget https://pkg.cfssl.org/R1.2/cfssl_linux-amd64

# wget https://pkg.cfssl.org/R1.2/cfssljson_linux-amd64

# chmod +x cfssl_linux-amd64

# chmod +x cfssljson_linux-amd64

 # sudo mv cfssl_linux-amd64 /usr/local/bin/cfssl

 # sudo mv cfssljson_linux-amd64 /usr/local/bin/cfssljson


2. Create a Certificate Authority (CA).

# cd tls_certificate

# cat > ca-config.json <<EOF

{

    "signing": {

        "default": {

            "expiry": "8760h"

        },

        "profiles": {

            "etcd": {

                "expiry": "8760h",

                "usages": ["signing","key encipherment","server auth","client auth"]

            }

        }

    }

}

EOF


# cat >  ca-csr.json  <<EOF

{

  "CN": "etcd cluster",

  "key": {

    "algo": "rsa",

    "size": 2048

  },

  "names": [

    {

      "C": "GB",

      "L": "England",

      "O": "Kubernetes",

      "OU": "ETCD-CA",

      "ST": "Cambridge"

    }

  ]

}

EOF


# cfssl gencert -initca ca-csr.json | cfssljson -bare ca


3. Create TLS certificates.

# cd tls_certificate

# cat >  etcd-csr.json <<EOF

{

  "CN": "etcd",

  "hosts": [

    "localhost",

    "127.0.0.1",

    "192.168.56.15",

    "192.168.56.16",

    "192.168.56.17",

    "192.168.56.18"

  ],

  "key": {

    "algo": "rsa",

    "size": 2048

  },

  "names": [

    {

      "C": "GB",

      "L": "England",

      "O": "Kubernetes",

      "OU": "etcd",

      "ST": "Cambridge"

    }

  ]

}

EOF


# cd tls_certificate

# cfssl gencert \

-ca=ca.pem \

-ca-key=ca-key.pem \

-config=ca-config.json \

-profile=etcd etcd-csr.json | \

cfssljson -bare etcd


4. Create two directories and copy the certificate to /etc/etcd on all master nodes

# mkdir -p /etc/etcd

# mkdir -p /var/lib/etcd

# cp -rvf  ca-key.pem  ca.pem etcd-key.pem  etcd.pem  /etc/etcd

# scp -r  ca-key.pem  ca.pem etcd-key.pem  etcd.pem   ETCD02:/etc/etcd

# scp -r  ca-key.pem  ca.pem etcd-key.pem  etcd.pem   ETCD03:/etc/etcd


5. Download etcd & etcdctl binaries from Github on all master nodes.

Ref :- https://github.com/etcd-io/etcd/releases/

# wget https://github.com/etcd-io/etcd/releases/download/v3.5.13/etcd-v3.5.13-linux-amd64.tar.gz

# tar xvf etcd-v3.5.13-linux-amd64.tar.gz

#  cd etcd-v3.5.13-linux-amd64

# mv  etcd*  /usr/bin

6. Create systemd unit file for etcd service on all master nodes.

# vim /etc/systemd/system/etcd.service

[Unit]

Description=etcd

Documentation=https://github.com/coreos


[Service]

ExecStart=/usr/bin/etcd \

  --name 192.168.56.15 \

  --cert-file=/etc/etcd/etcd.pem \

  --key-file=/etc/etcd/etcd-key.pem \

  --peer-cert-file=/etc/etcd/etcd.pem \

  --peer-key-file=/etc/etcd/etcd-key.pem \

  --trusted-ca-file=/etc/etcd/ca.pem \

  --peer-trusted-ca-file=/etc/etcd/ca.pem \

  --peer-client-cert-auth \

  --client-cert-auth \

  --initial-advertise-peer-urls https://192.168.56.15:2380 \

  --listen-peer-urls https://192.168.56.15:2380 \

  --listen-client-urls https://192.168.56.15:2379,http://127.0.0.1:2379 \

  --advertise-client-urls https://192.168.56.15:2379 \

  --initial-cluster-token etcd-cluster-0 \

  --initial-cluster 192.168.56.15=https://192.168.56.15:2380,192.168.56.16=https://192.168.56.16:2380,192.168.56.17=https://192.168.56.17:2380 \

  --initial-cluster-state new \

  --data-dir=/var/lib/etcd

Restart=on-failure

RestartSec=5


[Install]

WantedBy=multi-user.target


Note:-  --initial-cluster-state new/existing (if already etcd service is running then use  existing parameter.)

# systemctl daemon-reload

# systemctl status etcd

# systemctl enable etcd.service

# systemctl start etcd.service

# systemctl status etcd

# etcdctl member list  or  ETCDCTL_API=3 etcdctl member list


# ETCDCTL_API=3 etcdctl endpoint status


# ETCDCTL_API=3 etcdctl endpoint health


#  ETCDCTL_API=3  etcdctl endpoint status --write-out=table


# ETCDCTL_API=3 etcdctl put name2 test_k8s

# ETCDCTL_API=3 etcdctl get name2


1. Install HAproxy on one master.

# yum install haproxy -y

VIP setup on interface.

# cat /etc/sysconfig/network-scripts/ifcfg-enp0s8

IPADDR1=192.168.56.15

IPADDR2=192.168.56.18

PREFIX1=24

PREFIX2=24

GATEWAY=192.168.56.1

# vim /etc/haproxy/haproxy.cfg

frontend k8s_VIP

        bind 192.168.56.18:6444

        option tcplog

        mode tcp

        default_backend  k8s_APP


backend k8s_APP

        mode tcp

        balance roundrobin

        option tcp-check

        server ETC01 192.168.56.15:6443 check fall 5 rise 3

        server ETC02 192.168.56.16:6443 check fall 5 rise 3

        server ETC03 192.168.56.17:6443 check fall 5 rise 3


# haproxy -c -f /etc/haproxy/haproxy.cfg

# systemctl status haproxy

# systemctl start haproxy


Install Kubernetes on all master node.

 1. Manually loading the modules on a Linux system.

overlay — The overlay module provides overlay filesystem support, which Kubernetes uses for its pod network abstraction.

br_netfilter — This module enables bridge netfilter support in the Linux kernel, which is required for Kubernetes networking and policy.

# sudo modprobe overlay

# sudo modprobe br_netfilter

2. kernel modules should be automatically loaded at boot time.

# cat <<EOF | sudo tee /etc/modules-load.d/containerd.conf
overlay
br_netfilter
EOF


3. sysctl parameters for Kubernetes networking.

# cat  <<EOF | sudo tee /etc/sysctl.d/kube.conf

net/bridge/bridge-nf-call-ip6tables = 1

net/bridge/bridge-nf-call-iptables = 1

net/bridge/bridge-nf-call-arptables = 1

net.ipv4.ip_forward = 1

EOF

Reloading the sysctl settings.

# sudo sysctl --system


3. Disable the swap memory.

# sudo sed -i '/ swap / s/^\(.*\)$/#\1/g' /etc/fstab

# swapoff -a

# free -m


4. Download the containerd package.

# yum install -y yum-utils

5. Add repo for containerd.

# yum-config-manager --add-repo https://download.docker.com/linux/centos/docker-ce.repo

# yum install containerd

6. Add repo for kubernetes.

# cat <<EOF | sudo tee /etc/yum.repos.d/kubernetes.repo

[kubernetes]

name=Kubernetes

baseurl=https://pkgs.k8s.io/core:/stable:/v1.29/rpm/

enabled=1

gpgcheck=1

gpgkey=https://pkgs.k8s.io/core:/stable:/v1.29/rpm/repodata/repomd.xml.key

EOF

7. install the kubelet , kubectl , kubeadm packages.

# yum install  kubelet kubectl kubeadm


8. location where the configuration file for containerd is stored.

# sudo containerd config default | sudo tee /etc/containerd/config.toml

Note:- SystemdCgroup has to be set to “true”

SystemdCgroup = true


# systemctl status containerd

# systemctl start containerd

# systemctl enable containerd

9. Install kubelet , kubeadm, kubectl package on the master.

# yum install kubelet kubeadm kubectl

# systemctl enable kubelet


# vim ClusterConfiguration.yaml

apiVersion: kubeadm.k8s.io/v1beta3

kind: ClusterConfiguration

kubernetesVersion: v1.29.0

controlPlaneEndpoint: "192.168.56.11:6444"

etcd:

  external:

    endpoints:

      - https://192.168.56.8:2379

      - https://192.168.56.9:2379

    caFile: /etc/etcd/ca.pem

    certFile: /etc/etcd/kubernetes.pem

    keyFile: /etc/etcd/kubernetes-key.pem

networking:

  podSubnet: 10.30.0.0/24

apiServer:

  certSANs:

    - "192.168.56.11"

  extraArgs:

    apiserver-count: "3"


# kubeadm init  --config=ClusterConfiguration.yaml --v=5


mkdir -p $HOME/.kube

  sudo cp -i /etc/kubernetes/admin.conf $HOME/.kube/config

  sudo chown $(id -u):$(id -g) $HOME/.kube/config


Alternatively, if you are the root user, you can run:


  export KUBECONFIG=/etc/kubernetes/admin.conf


You should now deploy a pod network to the cluster.

Run "kubectl apply -f [podnetwork].yaml" with one of the options listed at:

  https://kubernetes.io/docs/concepts/cluster-administration/addons/


You can now join any number of control-plane nodes by copying certificate authorities

and service account keys on each node and then running the following as root:


  kubeadm join 192.168.56.18:6444 --token ewa7om.7pv5tumd4a99r5qq \

        --discovery-token-ca-cert-hash sha256:e2baff69f0df3ace226b5f7a1c89dff4422e1fde503f50ab42541a46015872bf \

        --control-plane


Then you can join any number of worker nodes by running the following on each as root:


kubeadm join 192.168.56.18:6444 --token ewa7om.7pv5tumd4a99r5qq \

        --discovery-token-ca-cert-hash sha256:e2baff69f0df3ace226b5f7a1c89dff4422e1fde503f50ab42541a46015872bf


10. Run the below command on the master node.

#   mkdir -p $HOME/.kube

#  sudo cp -i /etc/kubernetes/admin.conf $HOME/.kube/config

#  sudo chown $(id -u):$(id -g) $HOME/.kube/config


# wget  https://raw.githubusercontent.com/projectcalico/calico/v3.27.3/manifests/calico.yaml


# kubectl apply -f calico.yaml

# kubectl get po -A

# kubectl  get nodes

NAME     STATUS     ROLES           AGE   VERSION

etcd01   Ready      control-plane   35h   v1.29.3


# cd  TLS_cetificates

# scp -r  etcd-key.pem etcd.pem ca.pem etcd02:/etc/kubernetes/pki/

# scp -r  etcd-key.pem etcd.pem ca.pem etcd03:/etc/kubernetes/pki/

# cd /etc/kubernetes/pki/

# scp -r  ca.crt ca.key front-proxy-ca.crt front-proxy-ca.key front-proxy-client.crt front-proxy-client.key sa.key sa.pub etcd02:/etc/kubernetes/pki/

scp -r  ca.crt ca.key front-proxy-ca.crt front-proxy-ca.key front-proxy-client.crt front-proxy-client.key sa.key sa.pub etcd03:/etc/kubernetes/pki/

11.Check port on master node
# netstat -ntlp | grep "6443"

tcp6       1      0 :::6443                 :::*                    LISTEN      4257/kube-apiserver

# ps -elf | grep “4257”

# kubectl get nodes


Thursday, 6 March 2025

Kubernetes Setup

 1. Master and Worker details

Node

IP

Management

10.9.0.5

master-1

10.10.0.11

worker-1

10.10.0.12

worker-2

10.10.0.13

worker-3

10.10.0.14

worker-4

10.10.0.15

worker-5

10.10.0.16

pods

172.10.11.0/24


2. Some commands run on all nodes.

# yum update -y

Disable selinux  and firewalld

# systemctl stop firewalld

# systemctl disable firewalld

# /etc/sysconfig/selinux

SELINUX=disable


3. Update hostname and  /etc/hosts file on all nodes.

# vim /etc/hostname

master-1

# vim /etc/hosts

10.10.0.11      master-1

10.10.0.12      worker-1

10.10.0.13      worker-2

10.10.0.14      worker-3

10.10.0.15      worker-4

10.10.0.16      worker-5

10.10.0.17      common


4. Manually loading the modules on a Linux system.

overlay — The overlay module provides overlay filesystem support, which Kubernetes uses for its pod network abstraction.

br_netfilter — This module enables bridge netfilter support in the Linux kernel, which is required for Kubernetes networking and policy.

# sudo modprobe overlay

# sudo modprobe br_netfilter


5. kernel modules should be automatically loaded at boot time.

# cat <<EOF | sudo tee /etc/modules-load.d/containerd.conf
overlay
br_netfilter
EOF


6. sysctl parameters for Kubernetes networking.

# cat  <<EOF | sudo tee /etc/sysctl.d/kube.conf

net/bridge/bridge-nf-call-ip6tables = 1

net/bridge/bridge-nf-call-iptables = 1

net/bridge/bridge-nf-call-arptables = 1

net.ipv4.ip_forward = 1

EOF

Reloading the sysctl settings.

# sudo sysctl --system


7. Disable the swap memory.

# sudo sed -i '/ swap / s/^\(.*\)$/#\1/g' /etc/fstab

# swapoff -a

# free -m

8. Download the containerd package.

# yum install -y yum-utils

9. Add repo for containerd.

# yum-config-manager --add-repo https://download.docker.com/linux/centos/docker-ce.repo

10. Add a repo for Kubernetes.

# cat <<EOF | sudo tee /etc/yum.repos.d/kubernetes.repo

[kubernetes]

name=Kubernetes

baseurl=https://pkgs.k8s.io/core:/stable:/v1.29/rpm/

enabled=1

gpgcheck=1

gpgkey=https://pkgs.k8s.io/core:/stable:/v1.29/rpm/repodata/repomd.xml.key

EOF


11. Install containerd on all nodes.

# yum install containerd -y


12. location where the configuration file for containerd is stored.

# sudo containerd config default | sudo tee /etc/containerd/config.toml

Note:- SystemdCgroup has to be set to “true”

SystemdCgroup = true


# systemctl status containerd

# systemctl start containerd

# systemctl enable containerd


13. Install kubelet and  kubeadm package on the worker node.

# yum install kubelet kubeadm -y

# systemctl enable kubelet


14. Install kubelet , kubeadm, kubectl package on the master node.

# yum install kubelet kubeadm kubectl -y

# systemctl enable kubelet


15. initializes a Kubernetes control-plane node with the specified Pod network CIDR.

# kubeadm init --pod-network-cidr=172.10.11.0/24

Note:-  If needed for cluster remove below command.

# kubeadmin reset


16. Run the below command on the master node.

#   mkdir -p $HOME/.kube

#  sudo cp -i /etc/kubernetes/admin.conf $HOME/.kube/config

#  sudo chown $(id -u):$(id -g) $HOME/.kube/config

For install CNI

# wget  https://raw.githubusercontent.com/projectcalico/calico/v3.27.3/manifests/calico.yaml

# kubectl apply -f calico.yaml

# kubectl get po -A

# kubectl  get nodes


17. Run below command in worker node for Join the worker with the master node :-

# kubeadm join 192.169.0.21:6443 --token bqyifs.ll4db25n0hb5x4t1 \

        --discovery-token-ca-cert-hash sha256:bcdc577bb0f1af8dcde2804a1d3066e2951f333d99a1892a91367e7174bf5100


# kubectl get nodes


# kubectl get po -A


Wednesday, 5 March 2025

Metrics Server and Kube-State-Metrics in Kubernetes.

 Metrics Server in Kubernetes


Metrics Server is a lightweight resource usage monitoring component in Kubernetes. It provides real-time CPU and memory metrics for nodes and pods, which are used by:

Does not store long-term data, only real-time values.

Only CPU & Memory is monitoring .

Horizontal Pod Autoscaler (HPA) – Auto-scales pods based on CPU/memory usage
kubectl top – View resource usage of pods and nodes
Custom Monitoring – Fetch live metrics via API

--kubelet-insecure-tls: Disable TLS verification when communicating with the kubelet (useful for self-signed certificates).

--kubelet-preferred-address-types: Specify the order of address types to use when connecting to the kubelet (e.g., InternalIPHostname).


# wget  https://github.com/kubernetes-sigs/metrics-server/releases/latest/download/components.yaml

# vim components.yaml

- --kubelet-insecure-tls

# kubectl apply -f components.yaml


# kubectl get pods -n kube-system | grep metrics-server

# kubectl logs -n kube-system -l k8s-app=metrics-server

# kubectl get pods -n kube-system | grep "metrics”


After installation, you can list the resources created by the Metrics Server:

kubectl get all -n kube-system | grep metrics-server


APIService:

An APIService named v1beta1.metrics.k8s.io registers the Metrics Server with the Kubernetes API.

# kubectl get apiservices


# kubectl top nodes


# kubectl top pods -A


These commands are used to check the health status of Kubernetes components, specifically the API server.

1.Readiness Probe Check (/readyz)

 Checks if the Kubernetes API server is ready to handle requests.

If the API server is not ready, it won’t accept new connections.

# kubectl get --raw /readyz

2.Liveness Probe Check (/livez)

Checks if the Kubernetes API server is alive (i.e., it has not crashed).

Used by kubelet to determine if the API server needs to be restarted.

# kubectl get --raw /livez

3.General Health Check (/healthz)

Checks the overall health of the API server

 # kubectl get --raw /healthz

4.Verify etcd is Healthy.

# kubectl get --raw /readyz?verbose


Deploying kube-state-metrics in Kubernetes.

# helm repo add prometheus-community https://prometheus-community.github.io/helm-charts

# helm repo update

# helm install kube-state-metrics prometheus-community/kube-state-metrics

# kubectl get pods -n default

# kubectl port-forward svc/kube-state-metrics 8080

# curl http://localhost:8080/metrics

                        or

# kubectl  get pods

# kubectl expose pod kube-state-metrics-5495d45756-p89mm --type=NodePort --port=8080 --name=metrics-svc

# kubectl describe svc metrics-svc


# curl http://10.107.59.111:8080/metrics

# curl http://10.107.59.111:8080/metrics | grep kube_node_info

# kubectl run nginx --image=nginx --port=80

# kubectl get pods


# curl http://10.107.59.111:8080/metrics | grep kube_pod_status_phase | grep "nginx


Common Metrics from kube-state-metrics

Metric Name

Description

kube_pod_status_phase

Shows the phase (Pending, Running, Succeeded, Failed) of each pod

kube_node_status_ready

Indicates if a node is ready (1 = Ready, 0 = Not Ready)

kube_deployment_status_replicas

Shows the number of replicas in a deployment

kube_statefulset_replicas

Shows the number of replicas in a StatefulSet


1️.Metrics Collection & Storage Tools

These tools collect real-time metrics and store them for analysis.

Tool

Features

Prometheus

Most popular, collects time-series data, integrates with Grafana & Alertmanager

cAdvisor

Built into Kubelet, provides container-level CPU, memory, and network stats

Kube-State-Metrics

Collects cluster state metrics (Pods, Deployments, Nodes) for Prometheus

Metrics Server

Provides CPU & memory metrics for Horizontal Pod Autoscaler (HPA)

InfluxDB

High-performance time-series database, alternative to Prometheus

OpenTelemetry

Standardized observability framework for traces, metrics, and logs

2️.Monitoring & Visualization Tools

These tools provide dashboards and real-time data visualization.

Tool

Features

Grafana

Best for visualizing Prometheus metrics, customizable dashboards

Kibana

Works with Elasticsearch for logging & metric visualization

Thanos

Extends Prometheus for long-term storage and high availability

Chronograf

Works with InfluxDB, provides dashboards & alerting

3️.Logging & Event Monitoring

These tools focus on log collection, indexing, and analysis.

Tool

Features

Elasticsearch + Kibana (ELK Stack)

Best for searching & analyzing logs

Loki (by Grafana)

Log aggregation, lightweight alternative to ELK

Fluentd

Collects logs and sends them to various backends (ELK, Loki, Splunk)

Logstash

Part of ELK stack, processes & filters logs

Graylog

Centralized log management with alerting features

4️.Distributed Tracing & Performance Monitoring

These tools help track requests across microservices.

Tool

Features

Jaeger

Distributed tracing, tracks requests across services

Zipkin

Similar to Jaeger, collects trace data from microservices

OpenTelemetry

Standardized observability framework (tracing, metrics, logs)

5️.Kubernetes-Native Monitoring & Cloud Solutions

These tools are cloud-native and integrate with Kubernetes.

Tool

Features

Datadog

SaaS-based K8s monitoring & security

New Relic

Full observability (metrics, logs, traces)

Dynatrace

AI-powered monitoring for Kubernetes, cloud, and apps

Google Cloud Operations (Stackdriver)

GCP-native monitoring for GKE

Azure Monitor for Containers

Azure-native monitoring for AKS

Amazon CloudWatch

AWS-native monitoring for EKS

  Prometheus (metrics) + Grafana (visualization) + Loki (logs) + Jaeger (tracing).