Metrics Server in Kubernetes
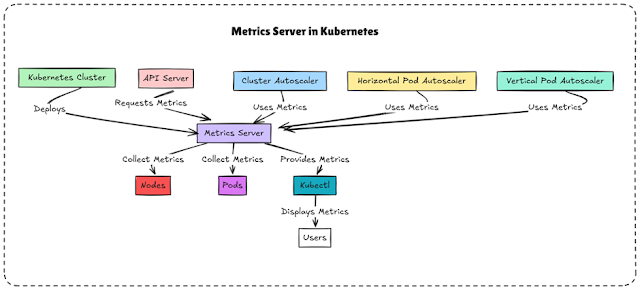
Metrics Server is a lightweight resource usage monitoring
component in Kubernetes. It provides real-time CPU and memory metrics
for nodes and pods, which are used by:
Does not store long-term data, only real-time values.
Only CPU & Memory is monitoring .
Horizontal Pod
Autoscaler (HPA) – Auto-scales pods based on CPU/memory usage
kubectl top – View resource usage of pods and nodes
Custom Monitoring – Fetch live metrics via API
--kubelet-insecure-tls: Disable TLS verification when
communicating with the kubelet (useful for self-signed certificates).
--kubelet-preferred-address-types: Specify the order of
address types to use when connecting to the kubelet (e.g., InternalIP, Hostname).
# wget https://github.com/kubernetes-sigs/metrics-server/releases/latest/download/components.yaml
# vim components.yaml
- --kubelet-insecure-tls
# kubectl apply -f components.yaml
# kubectl get pods -n kube-system | grep metrics-server
# kubectl logs -n kube-system -l k8s-app=metrics-server
# kubectl get pods -n kube-system | grep "metrics”

After installation, you can list the resources created by
the Metrics Server:
kubectl get all -n kube-system | grep metrics-server

APIService:
An APIService
named v1beta1.metrics.k8s.io registers the Metrics Server with the
Kubernetes API.
# kubectl get apiservices

# kubectl top nodes

# kubectl top pods -A

These commands are used to check the health status of
Kubernetes components, specifically the API server.
1.Readiness
Probe Check (/readyz)
Checks if the Kubernetes
API server is ready to handle requests.
If the API server is not ready, it won’t accept new
connections.
# kubectl get --raw /readyz
2.Liveness
Probe Check (/livez)
Checks if the Kubernetes API server is alive (i.e.,
it has not crashed).
Used by kubelet to determine if the API server needs
to be restarted.
# kubectl get --raw /livez
3.General
Health Check (/healthz)
Checks the overall health of the API server
# kubectl get --raw /healthz
4.Verify
etcd is Healthy.
# kubectl get --raw /readyz?verbose
Deploying kube-state-metrics in Kubernetes.
# helm repo add prometheus-community
https://prometheus-community.github.io/helm-charts
# helm repo update
# helm install kube-state-metrics prometheus-community/kube-state-metrics
# kubectl get pods -n default
# kubectl port-forward svc/kube-state-metrics 8080
# curl http://localhost:8080/metrics
or
# kubectl get pods
# kubectl expose pod kube-state-metrics-5495d45756-p89mm
--type=NodePort --port=8080 --name=metrics-svc
# kubectl describe svc metrics-svc

# curl http://10.107.59.111:8080/metrics
# curl http://10.107.59.111:8080/metrics | grep kube_node_info
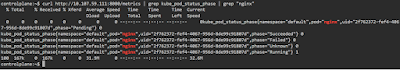
# kubectl run nginx --image=nginx --port=80
# kubectl get pods

# curl http://10.107.59.111:8080/metrics | grep
kube_pod_status_phase | grep "nginx
Common Metrics from kube-state-metrics
|
Metric Name |
Description |
|
kube_pod_status_phase |
Shows the phase (Pending, Running, Succeeded,
Failed) of each pod |
|
kube_node_status_ready |
Indicates if a node is ready (1 = Ready, 0 = Not
Ready) |
|
kube_deployment_status_replicas |
Shows the number of replicas in a deployment |
|
kube_statefulset_replicas |
Shows the number of replicas in a StatefulSet |
1️.Metrics Collection &
Storage Tools
These tools collect real-time metrics and store them for
analysis.
|
Tool |
Features |
|
Prometheus |
Most popular, collects time-series data,
integrates with Grafana & Alertmanager |
|
cAdvisor |
Built into Kubelet, provides container-level CPU,
memory, and network stats |
|
Kube-State-Metrics |
Collects cluster state metrics (Pods,
Deployments, Nodes) for Prometheus |
|
Metrics Server |
Provides CPU & memory metrics for Horizontal
Pod Autoscaler (HPA) |
|
InfluxDB |
High-performance time-series database,
alternative to Prometheus |
|
OpenTelemetry |
Standardized observability framework for traces,
metrics, and logs |
2️.Monitoring & Visualization
Tools
These tools provide dashboards and real-time data
visualization.
|
Tool |
Features |
|
Grafana |
Best for visualizing Prometheus metrics,
customizable dashboards |
|
Kibana |
Works with Elasticsearch for logging &
metric visualization |
|
Thanos |
Extends Prometheus for long-term storage and
high availability |
|
Chronograf |
Works with InfluxDB, provides dashboards &
alerting |
3️.Logging & Event Monitoring
These tools focus on log collection, indexing, and
analysis.
|
Tool |
Features |
|
Elasticsearch + Kibana (ELK Stack) |
Best for searching & analyzing logs |
|
Loki (by Grafana) |
Log aggregation, lightweight alternative to ELK |
|
Fluentd |
Collects logs and sends them to various backends
(ELK, Loki, Splunk) |
|
Logstash |
Part of ELK stack, processes & filters logs |
|
Graylog |
Centralized log management with alerting features |
4️.Distributed Tracing &
Performance Monitoring
These tools help track requests across microservices.
|
Tool |
Features |
|
Jaeger |
Distributed tracing, tracks requests across services |
|
Zipkin |
Similar to Jaeger, collects trace data from
microservices |
|
OpenTelemetry |
Standardized observability framework (tracing,
metrics, logs) |
5️.Kubernetes-Native Monitoring
& Cloud Solutions
These tools are cloud-native and integrate with Kubernetes.
|
Tool |
Features |
|
Datadog |
SaaS-based K8s monitoring & security |
|
New Relic |
Full observability (metrics, logs, traces) |
|
Dynatrace |
AI-powered monitoring for Kubernetes, cloud, and
apps |
|
Google Cloud Operations (Stackdriver) |
GCP-native monitoring for GKE |
|
Azure Monitor for Containers |
Azure-native monitoring for AKS |
|
Amazon CloudWatch |
AWS-native monitoring for EKS |
No comments:
Post a Comment